Creative Data > Creative Data
VICTORIA 285
LEO BURNETT, Madrid / AXA / 2023
Awards:
Overview
Credits
Overview
Why is this work relevant for Creative Data?
The idea is basically the translation of data into human looks, to impact the audience and make them think.
We started with data taken from a report from UN Women and another one from the World Economic Forum that study how many years will it take us to achieve different goals that will eventually take us to a fully equal world. According to them, we still need 285 years to get there. So, to make this data visually impactful and show how much society still needs to advance, we showed how would aging until 285 years old would look like.
Background
Axa, as an insurance company, wants to make people live their lives with less risks. Not only the material ones, but all of them. It's part of their corporate social responsibility.
Today, being a woman is still a risk due to gender inequality.
So this campaign aims to make people aware of it, and move all of us to accelerate the changes we still need to make for this not to be a risk anymore.
Axa itself is taking giant steps in this direction, being an example for other companies, but also supporting initiatives, and giving people the tools to do more.
Please provide any cultural context that would help the jury understand any cultural, national or regional nuances applicable to this work e.g. local legislation, cultural norms, a national holiday or religious festival that may have a particular meaning.
In Spain, lots of things have been done towards gender equality. And people do think that we were almost there. But we still have a long way to go.
Shortly before the campaign there was a huge scandal in which the president of the Spanish Football Federation, Luis Rubiales, kissed the captain of the Women's National team in her mouth to celebrate winning the World Cup, without any consent. The discussion after this in media and social networks reminded people that there's still a big part of society that doesn't understand what this is about.
Plus, there were some more public incidents that also went in this direction, opening new discussions that most people though that had been left in the past.
So it proved us how important was to make people aware that even when we think we are moving fast, we are not. We still have a lot to do, and we should even accelerate more the approval of laws and the closure of the gender gap if we want this generation to really live in an equal world.
Describe the Creative idea / data solution
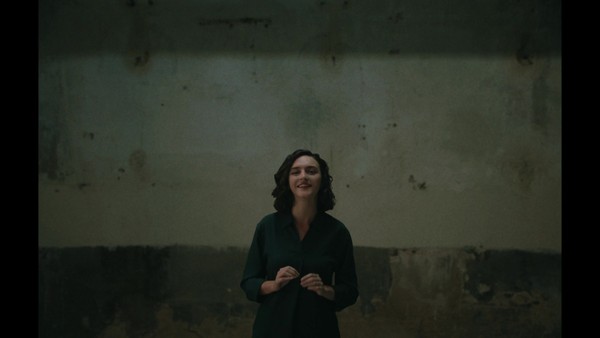
The idea shows a 25 years old woman that reminds us some of the women´s and society´s achievements in the last 100 years towards gender equality, marking how many years have past since each of them was achieved. But then, she starts to explain how many years we still need to get to some other achievements, and as she mentions each of them, she gets older. All this happens in the same take with no cuts. When we think she can't get older she keeps aging, showing us that it will take longer than we think, getting until she is 285 years old.
The "innovation" is imagining how a 285 year old woman would look like and seeing her aging slowly until then, to prove how much time we still have to wait to live in an equal world if we keep moving forward society at the current pace.
Describe the data driven strategy
To translate this data into human aging we used a mix of techniques. We started from references of the oldest people in the world to train the AI. But it had a limit, so the following step was again a mix of techniques and medical references of what happens to our bodies as we age, to train the AI in a different way, while we interpreted the results with a human perspective since so far it is scientifically impossible to age that much.
The goal was to translate and visualize this data in a way that would make people feel how much time they would have to live, to live in an equal world, and how inhuman it is to wait for so long.
This also allowed us to make people work against this data and predictions, making things go faster, so this can happen sooner than that.
Describe the creative use of data, or how the data enhanced the creative output
Data was key to help us see and face the problem and show the size of it. The visualization of it made us feel the anger and the need to change that number right away.
Nobody has seen a 285 year old person and the simple fact of watching someone aging until then, proved to be a very impactful way to move people.
List the data driven results
-In just one week and a half the video got +1.7M views on youtube (40% coming from whatsapp, proving the viral effect of it), with a moderate media investment.
-On Instagram, 90% of the people who watched it organically were non Axa followers.
-82% positive sentiment
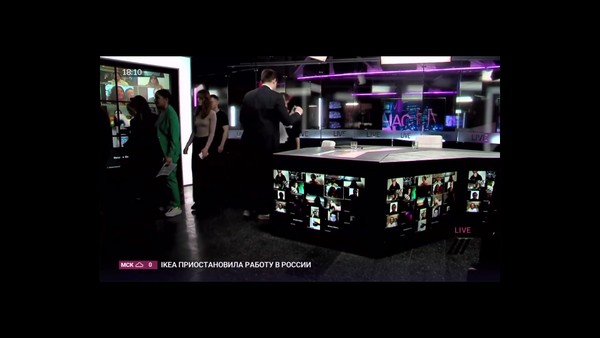
-The campaign got to the media and open discussion in different forums.
More Entries from Data Visualisation in Creative Data
24 items
More Entries from LEO BURNETT
24 items