Creative Data > Creative Data
LIVE LOGO
MARURI GREY, Guayaquil / INEC: NATIONAL STATISTICS INSTITUTE / 2016
Awards:

Overview
Credits
Overview
CampaignDescription
The creative idea was simple. To visually expose the data that reflects the well being of the population in real time to all Ecuadorians.
That simple idea resulted in a circular chart design composed by 5 inner circles that represent Literacy, Access to Water, Healthcare, Employment and Happiness.
Each circular shape is a variable.
The circles in the design are filled with Ecuador's flag colors according to the evolution of each variable. The logo updates automatically and constantly based on the INEC's data.
As variables change the logo mutate its form.
MediaStrategy
Without the real statistics collected by INEC, our Live logo would not be a relevant tool for people in Ecuador to use. The way the data is represented helps us design and form the shapes and create the redesigned INEC Logo.
Outcome
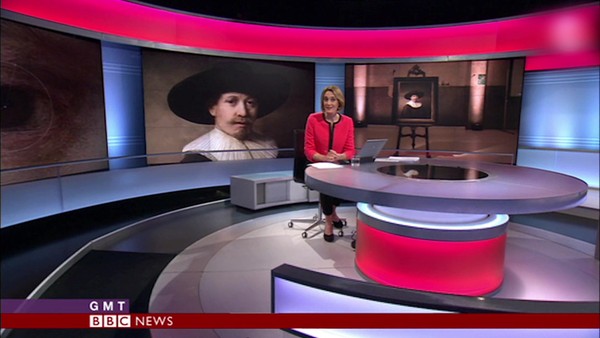
A simple logo of a rather boring institution became the representation of Ecuador's past, present and future. Media began using it on a day to day basis together with their news to reflect the country's situation. Press and tv anchors showed current events affecting one of the variables, Happiness.
INEC's brand recognition went from 33% to 59% in only 3 months. Its reputation as a non-political, technical, transparent institution tripled.
After the earthquake, millions of Ecuadorians who are trying to rebuild our nation used the logo as a motivation to get back the way we were before in a visible way.
Relevancy
Data is the essence of our idea. The statistics were always there but we decided to extract the relevant variables from them and showed them to the people in Ecuador using a dynamic LIVE LOGO.
The logo updates automatically and constantly based on the INEC's data. As variables change the logo mutates its form.
Strategy
INEC, the official statistic government organization, has the power and mission not only to collect the data but to distribute the information making sure the whole country has access to it.
From all data that INEC measures we picked the ones that are more relevant to our target audience, which is all Ecuadorians. The colors selected for the logo were based on our country's flag, Yellow, Blue and Red which automatically represent pride and a confirmation of "official" national information.
This logo is much more than a logo, it is the history of the evolution of our country. It shows where we come from but it also shows where we still need to go.
It is a logo that only Ecuadorians working together have the power to change.
Synopsis
Ecuadorians citizens have not been exposed to statistic variables that reflects our country status as a whole. However, these variables like Literacy, Access to Water, Healthcare, Employment and Happiness are key to determine the general well being of the population.
INEC, The National Institute of Statistics and Censuses is the official Data and Research organization for the Government. Their brief was "we need a new logo".
The objective was to refresh their image, to look more modern and friendly to the population.
Initial budget was $5,000.
The logo needed to be applicable to all mediums, including signage, stationary and digital.
More Entries from Data Visualisation in Creative Data
24 items
More Entries from MARURI GREY
24 items


