Creative Data > Creative Data
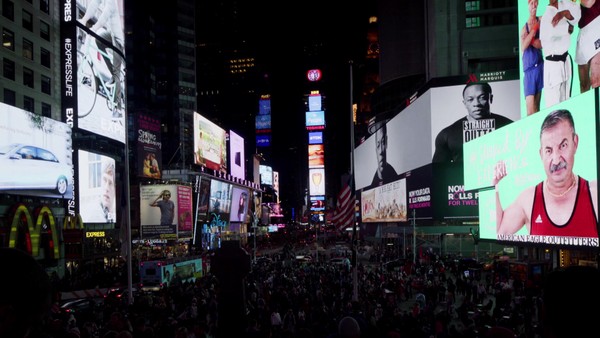
Times Square Re-imagined
BLOOMBERG, New York / MORGAN STANLEY / 2017
Overview
Credits
Overview
CampaignDescription
The idea was to create a design and graphic language for the signage that updates the historic Morgan Stanley ticker into something modern, engaging and dynamic. What makes this solution so unique is the use of live data paired with cutting-edge design and how those two elements interact. The approach translates market data, something that is traditionally mundane, into a cinematic and memorable experience.
MediaStrategy
The design system was created to be beautiful and engaging, yet practical by leveraging the flow of live data. Translating market data into a compelling visual was an important step of the process, and the use of real-time data makes the content even more relevant -- a quality that differentiates this digital billboard from the others in Times Square. For example, the high price of oil on a given day is visualized differently than the price of gold depending on the market value at that time.
In the end, 14 different exchanges and hundreds of live news headlines were selected to supplement Morgan Stanley brand content, all of which generates a well-balanced rhythm of engaging content tuned to each day.
Outcome
Morgan Stanley’s digital signage generates over 2,000 distinct pieces of content each day, informed by over 4 billion kilobytes of live data, reaching an audience of 460,000 people each day and 167 million people each year.
Beyond the numbers, the signage serves as a modern and active outlet for Morgan Stanley – a way for the brand to connect with the world as a leading financial institution on the pulse of technology and innovation. This design and data-driven solution has allowed Morgan Stanley to build and reinforce its brand equity in one of the most public squares in the world.
Relevancy
These real-time digital boards re-imagine content-driven environmental signage, covering 13,000 square feet, a full city block wide, and featuring 7 screens -- all running on live data.
Live market data and news feeds coupled with custom systems design and real-time content production result in a cinematic data visualization unlike any other.
Combining art, data and technology, the system utilizes billions of kilobytes of market and news information, creating over 2,000 distinct pieces of content each day.
Dynamically-generated playlists are tailored specifically to the changing audience and visually adjust with market changes. This is real-time data visualized as never seen before.
Strategy
Considering the diverse and fluctuating audience of Times Square, the data application required a unique approach.
The goal was to create relevant, engaging content that is immediately understandable to the average consumer, while also interesting and practical for Morgan Stanley's very own clients and employees.
With this in mind, the creative agency worked closely with its fellow data experts to identify the essential market data and news that would be appropriate and impactful on the signage.
Synopsis
As Morgan Stanley planned to refresh the iconic screens at their world headquarters, they saw the update as an opportunity to reinforce their presence in Times Square. They invested in 13,000 square feet of (7) high-resolution screens and were in need of a unique creative partner to help them create, design and produce fresh content for those screens.
The project represents a new and unusual undertaking for the teams involved, though it stems from a collaborator specialty: data.
More Entries from Data Storytelling in Creative Data
24 items


More Entries from BLOOMBERG
24 items