Digital Craft > Data & AI
SELF-ISOLATION INDEX
YANDEX, Moscow / YANDEX / 2020
Overview
Credits
Overview
Describe the creative idea
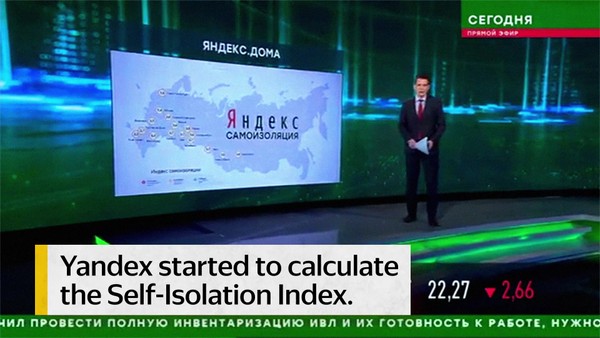
To be safe from Covid it was vital to stay home. The president announced days off of work to maintain a self-isolation regime, however, many people went out on the streets spreading the virus. Yandex, Russia’s largest IT developer of over 20 apps and services for urban life, came up with a simple idea: just as you can’t change the temperature if you don’t measure it, you can’t change the number of people on the streets if you don’t know how many are there. That is how the Self-Isolation Index was developed. This is an anonymous data-based tool that showed how well people were self-isolating in different cities in real time. We made it in a form of a simple 5-grade scale. To make this index more emotional, we colored it: red meant the citizens were on the streets and in danger, green meant they were at home and safe.
Describe the execution
Yandex’s ecosystem includes dozens of mobile apps for a convenient city living, like maps, taxi, movie and music streaming, food delivery, etc. These apps are used by over 60% of Russian mobile users. Our homepage yandex.ru is the most visited page in Russian language internet with over 70mln daily views and around 70% of mobile traffic.
That is why when Covid came and the national self-isolation regime was announced, we started noticing changes in how people used our apps. Staying self-isolated, people didn't plan many routes, didn’t use metro map or order taxis. At the same time they ordered more deliveries, read more content and news feeds, watched more movies. We compared these anonymous trends from over 85mln users of our 24 main services and apps with the same data from before the pandemic. After all calculations we aggregated the result into a simple 0 to 5 grades scale where 0 was equal to the regular activity on a day before the pandemic, and 5 meant most people were at home.
We placed the Index on yandex.ru, so it became impossible to ignore for anyone: regular users, bloggers, media and even officials. We also replaced an indicator of city traffic in all our map-based apps with our Index, as people looked at them 2 times a day.
The Index was measured in real time for 173 cities with over 100k population. We sent push notifications daily and when Index changed by more than 0.3 points, so people were kept up to date.
More Entries from Data Visualisation in Digital Craft
24 items

More Entries from YANDEX
21 items